
04 18 13
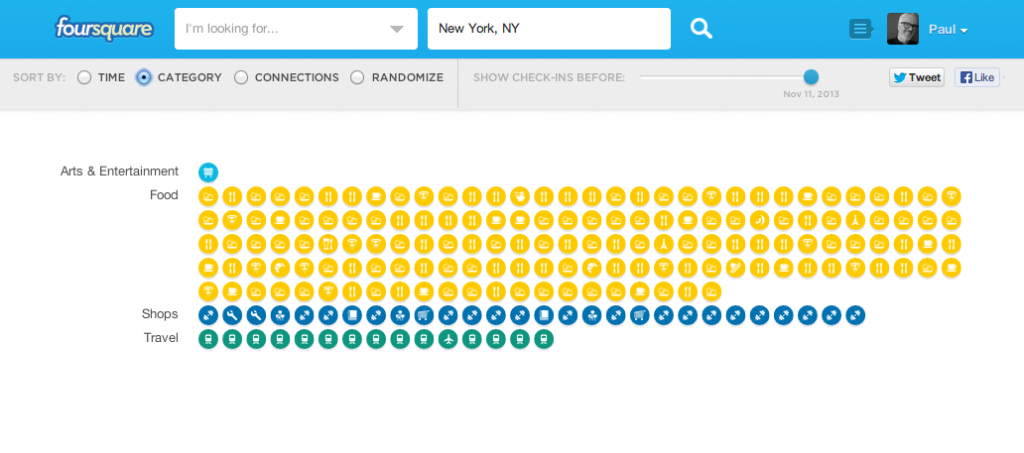
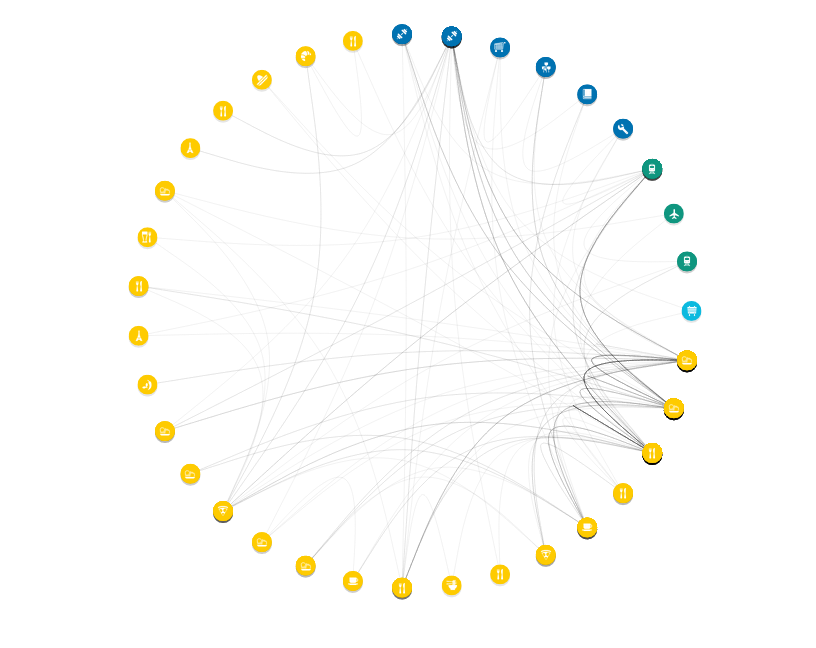
Visualize this… No secret that the world is moving to big data and all that it entails. One key related trend is data visualization. Often helpful to both increase effectiveness of communications and overall engagement with content, smart data visualization can be worth its weight in gold. Our clever and innovative friends at Foursquare have just introduced their check-in visualization tool. You can quickly see all your check-ins by time, category, connections or randomly (why not!). So see how you spend way too much time at the gym, that crazy good pizza joint or your neighborhood hangout. Think about spreadin’ the wealth or not…


